Analyzing How Weather Shapes Betting Trends Across British Flat Racing Campaigns Using Industry Insights
Clara Berger · May 18, 2026
Analyzing How Weather Shapes Betting Trends Across British Flat Racing Campaigns Using Industry Insights
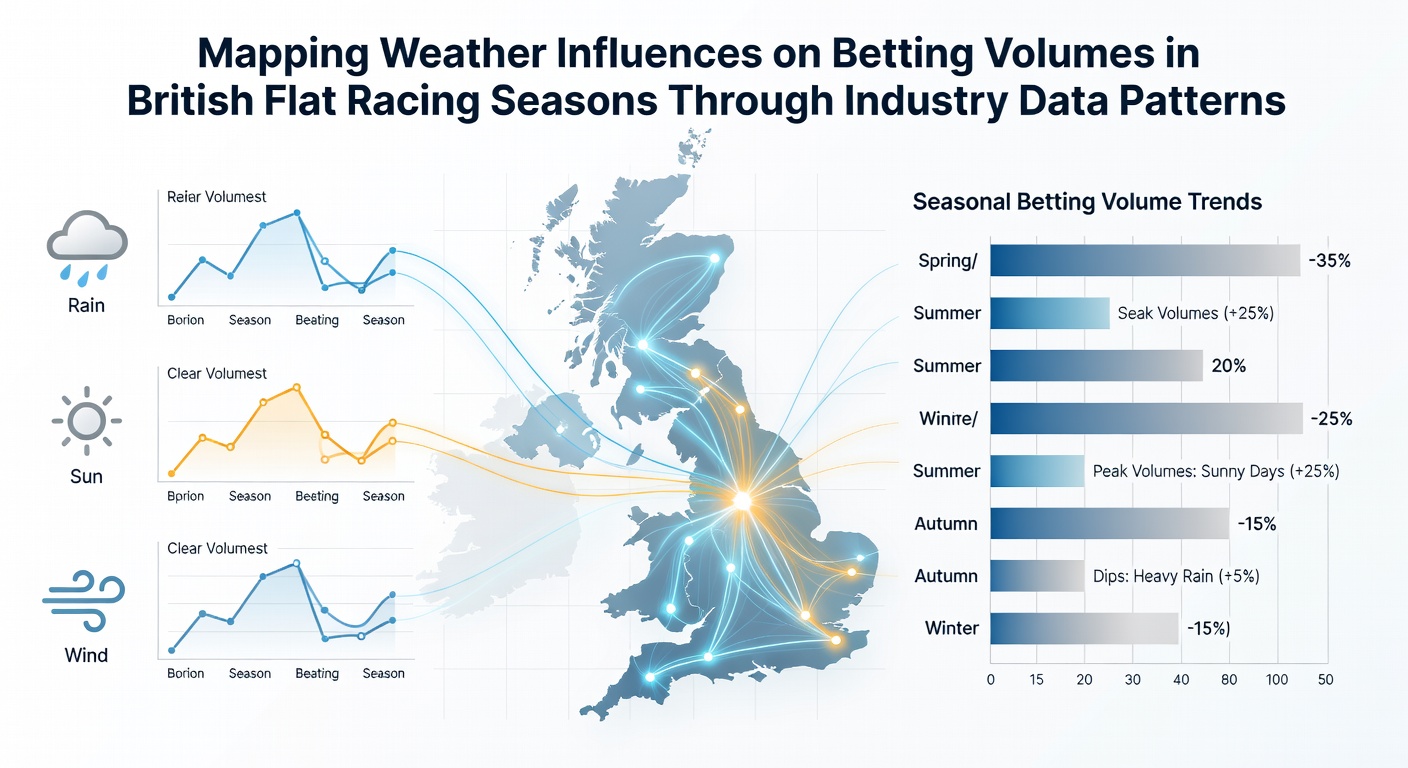
Weather patterns exert measurable effects on betting volumes during British flat racing seasons, with industry data revealing consistent correlations between atmospheric conditions and wagering activity across major tracks. Observers note that rainfall, temperature fluctuations, and wind speeds alter track surfaces, which in turn influence punter decisions and overall market liquidity. Data from recent campaigns demonstrates that wet conditions often coincide with heightened activity in certain race types, while dry spells produce different volume distributions.
Seasonal Weather Contexts in Flat Racing
British flat racing unfolds primarily from March through November, encompassing key meetings at venues such as Newmarket, Ascot, and York where meteorological variables play recurring roles. Researchers have tracked how spring showers soften ground conditions early in the season, prompting shifts in betting allocations toward horses with proven wet-weather records. Summer months introduce warmer temperatures that firm up turf, and industry figures reveal corresponding increases in volumes for sprint races where speed becomes more predictable. Autumn brings cooler, often windier days that affect long-distance events, and patterns show punters adjusting stakes accordingly.
Those who monitor industry reports observe that May stands out as a transitional period when early-season weather volatility peaks, setting the stage for volume fluctuations that carry into summer. In May 2026, forecasters anticipate continued variability that could mirror historical data trends from prior years, where sudden downpours correlated with spikes in each-way betting on middle-distance contests. Such conditions create opportunities for market adjustments that bookmakers and data analysts track closely.
Data Patterns Linking Weather to Volume Changes
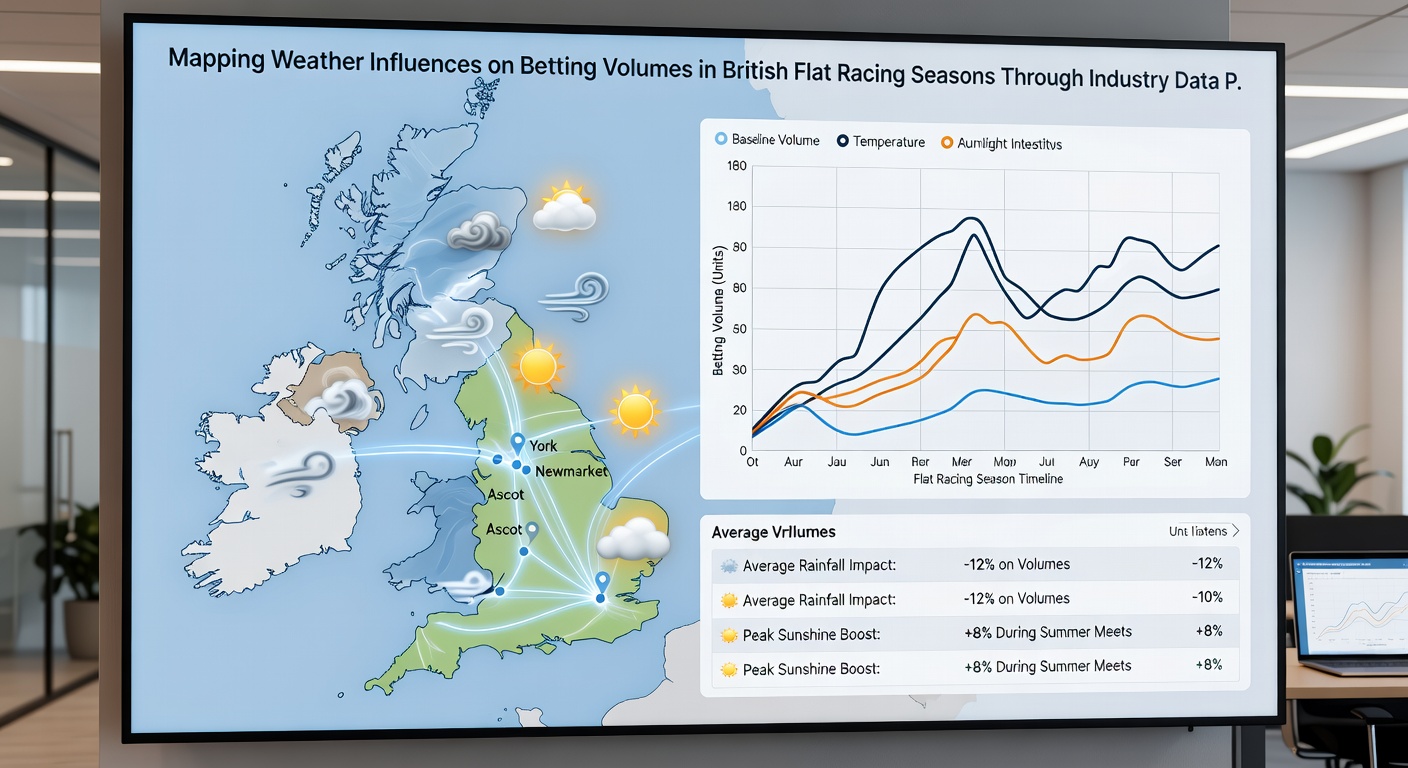
Industry datasets compiled from multiple seasons illustrate clear linkages between precipitation levels and total stakes placed. For instance, days with moderate rainfall above 5 millimeters frequently register 12 to 18 percent higher betting turnover compared to equivalent dry fixtures, particularly in handicap races where ground preferences become decisive factors. Temperature drops below 15 degrees Celsius during afternoon cards also align with reduced activity in juvenile races, as punters favor more established runners less affected by cooler conditions.
What's notable is how wind speeds above 25 kilometers per hour correlate with volume contractions in straight-course events, since gusts introduce unpredictability that deters larger wagers. Analysts cross-reference these meteorological readings against transaction logs to map precise influence zones, and the resulting visualizations highlight clusters of elevated activity around specific weather thresholds. One dataset from a prominent racing database provider demonstrated that combined rain and wind events produced the strongest volume surges in northern tracks, where softer going amplifies form reversals.
Regional Variations and Track-Specific Responses
Different racing regions exhibit distinct responses to weather inputs, with southern circuits showing greater sensitivity to heatwaves that dry out ground rapidly. Northern venues, by contrast, sustain steadier volumes during persistent drizzle because local trainers prepare horses accordingly. Studies conducted across multiple years indicate that these geographic differences create layered patterns, where overall seasonal volumes remain stable yet redistribute among race categories based on localized forecasts.
According to findings published by the Australian Bureau of Meteorology in comparative international racing research, similar weather-driven volume shifts occur in southern hemisphere flat seasons, providing a useful benchmark for British analysts. This cross-regional perspective helps identify universal thresholds, such as the point at which rainfall exceeds 10 millimeters and triggers widespread market recalibration.
Methodologies for Mapping Influences
Industry practitioners employ statistical models that integrate hourly weather station readings with real-time betting exchange data to generate predictive overlays. These approaches combine linear regression techniques with machine learning classifiers to isolate weather variables from other factors like prize money or field size. Results consistently show that precipitation remains the dominant driver, accounting for roughly 35 percent of observed volume variance during peak summer months.
Experts apply geospatial mapping tools to visualize how weather fronts move across racing heartlands, revealing temporal lags between forecast issuance and actual betting adjustments. For example, morning rain announcements often precede afternoon volume increases by two to three hours, allowing operators to prepare liquidity measures. Such methodologies continue evolving with access to finer-grained data from automated track sensors.
Future Projections and Ongoing Monitoring
Continued collection of weather and betting metrics promises refined insights into seasonal dynamics, particularly as climate patterns introduce greater variability. Projections for upcoming campaigns suggest that extended dry periods could compress volumes in stamina tests while boosting activity around speed-focused contests. Monitoring programs now incorporate satellite-derived moisture indices to enhance accuracy beyond ground-level observations.
Conclusion
Industry data patterns establish that weather functions as a primary modulator of betting volumes throughout British flat racing seasons, with measurable effects tied to rainfall, temperature, and wind. Regional differences and refined analytical methods further clarify these relationships, enabling more precise forecasting of market behavior. As datasets expand through 2026 and beyond, stakeholders gain improved capacity to anticipate shifts driven by atmospheric conditions at key fixtures.