Greyhound Racing Trap Draws: How Position Patterns Affect Results at UK Independent Tracks
Ines Richter · Jun 29, 2026
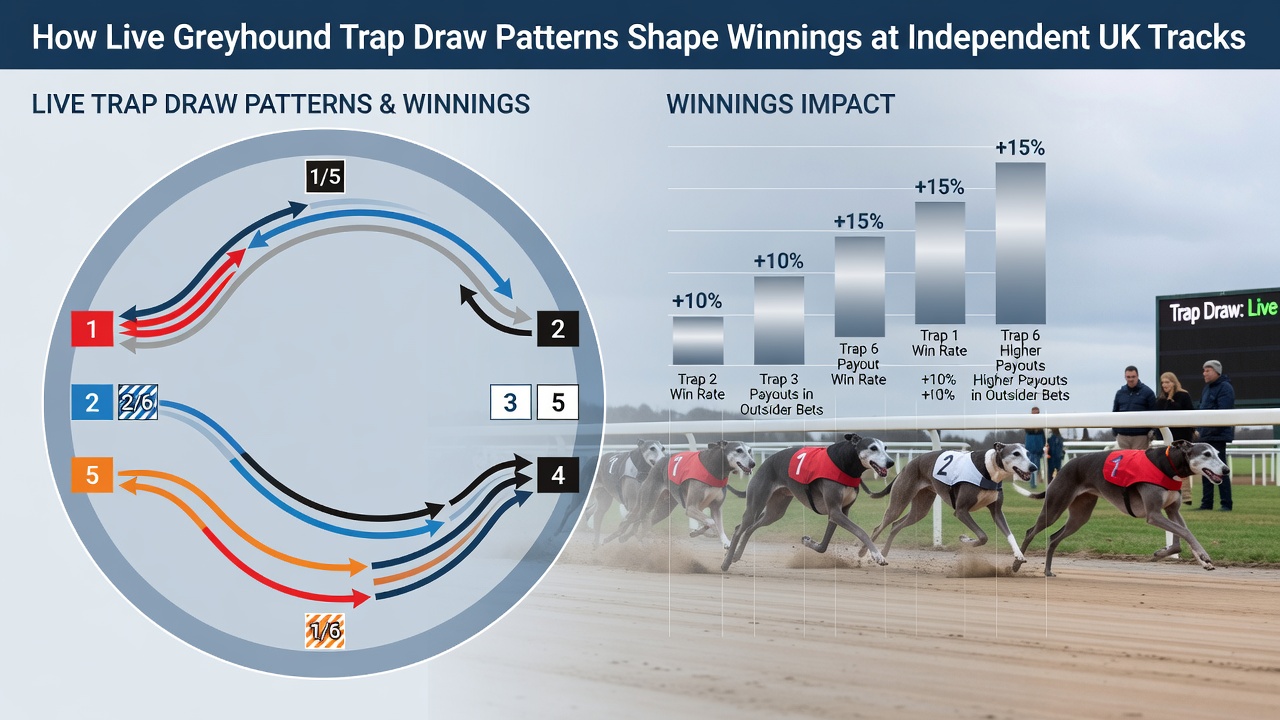
Greyhound Racing Trap Draws: How Position Patterns Affect Results at UK Independent Tracks
Independent greyhound tracks across the UK operate under distinct conditions compared to major circuits, and trap draw patterns play a central role in shaping race outcomes and betting returns. Live draws determine starting positions for each greyhound, with traps numbered one through six running from the inside rail outward, and statistical analysis of thousands of races reveals consistent biases tied to these positions at venues that maintain their own racing calendars.
Core Mechanics of Trap Assignments
Each race begins with a random or semi-random allocation of dogs to traps, yet observers note that certain positions deliver measurable advantages due to track geometry and bend entry angles. Trap one often benefits from the shortest path around the first turn, while trap six faces greater distance and potential interference from inner runners, and data compiled from independent meetings shows trap one securing victories at rates exceeding 25 percent in many sessions.
Observed Win Rate Variations Across Venues
Independent tracks such as those in regional circuits record trap-specific success rates that diverge from national averages because of shorter straights or tighter bends unique to each site. Studies from external racing bodies indicate trap three and four frequently outperform expectations on wider circuits since they avoid early crowding, whereas traps five and six post lower strike rates on tighter layouts where outside runners lose ground early. These patterns emerge from race data collected over multiple seasons, allowing analysts to map historical performance without relying on subjective forecasts.
Live Draw Influence on Betting Markets
When draws occur immediately before racing, bettors adjust stakes based on established trap trends at that specific venue, and this real-time information creates shifts in odds that reflect the probability adjustments. Research from the Irish Greyhound Board highlights how similar independent-style tracks in neighboring regions demonstrate comparable trap biases, reinforcing the value of venue-specific records over generic assumptions. Patterns become particularly pronounced during evening meetings where track conditions remain consistent, enabling those who review prior results to identify recurring advantages for inside or middle traps.
Seasonal and Surface Factors
Weather and track maintenance further modulate trap effectiveness, with rain-softened ground often favoring railers in trap one and two because they maintain better traction through turns. Data collected through June 2026 at several independent sites shows elevated win percentages for trap two during wet periods, while drier surfaces allow wider traps to close gaps more effectively on the back straight. These environmental variables combine with draw outcomes to produce layered probability models that experienced followers consult before placing wagers.
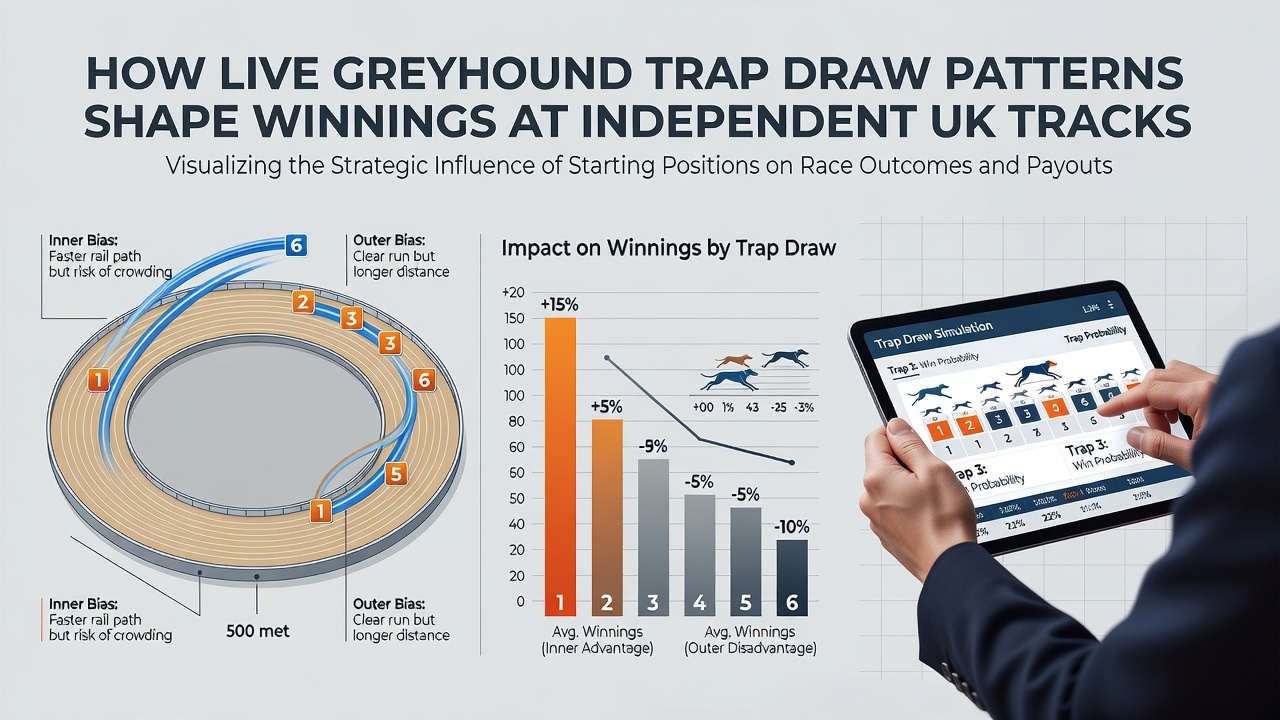
Case Examples from Regional Meetings
One series of meetings at a northern independent track revealed trap four claiming over 30 percent of wins across a 12-week period because the configuration allowed that position to avoid early traffic yet still reach the first bend in contention. Another southern venue produced elevated returns for trap one during summer months when firmer ground rewarded inside runners with cleaner runs, and records from these events demonstrate how repeated analysis of draw results can inform position-based selections without guaranteeing outcomes. Such examples illustrate the cumulative effect of trap patterns rather than isolated anomalies.
Integration with Broader Racing Data
Industry reports compiled by groups such as Greyhound Racing NSW in Australia provide comparative benchmarks that underscore how independent UK tracks exhibit more pronounced trap biases than highly standardized major circuits. This contrast arises because smaller venues lack the uniform resurfacing schedules common elsewhere, allowing natural variations in camber and rail position to influence results consistently. Those who cross-reference local draw statistics with international findings gain a clearer view of position-driven advantages that persist across different racing environments.
Conclusion
Trap draw patterns at independent UK greyhound tracks establish measurable frameworks for understanding race results through accumulated performance data, environmental adjustments, and venue-specific trends. Observers who examine these elements find structured approaches to interpreting live draws that connect starting positions directly to historical outcomes, while external regulatory and racing sources supply additional context for refining such analyses across seasons.